Stats
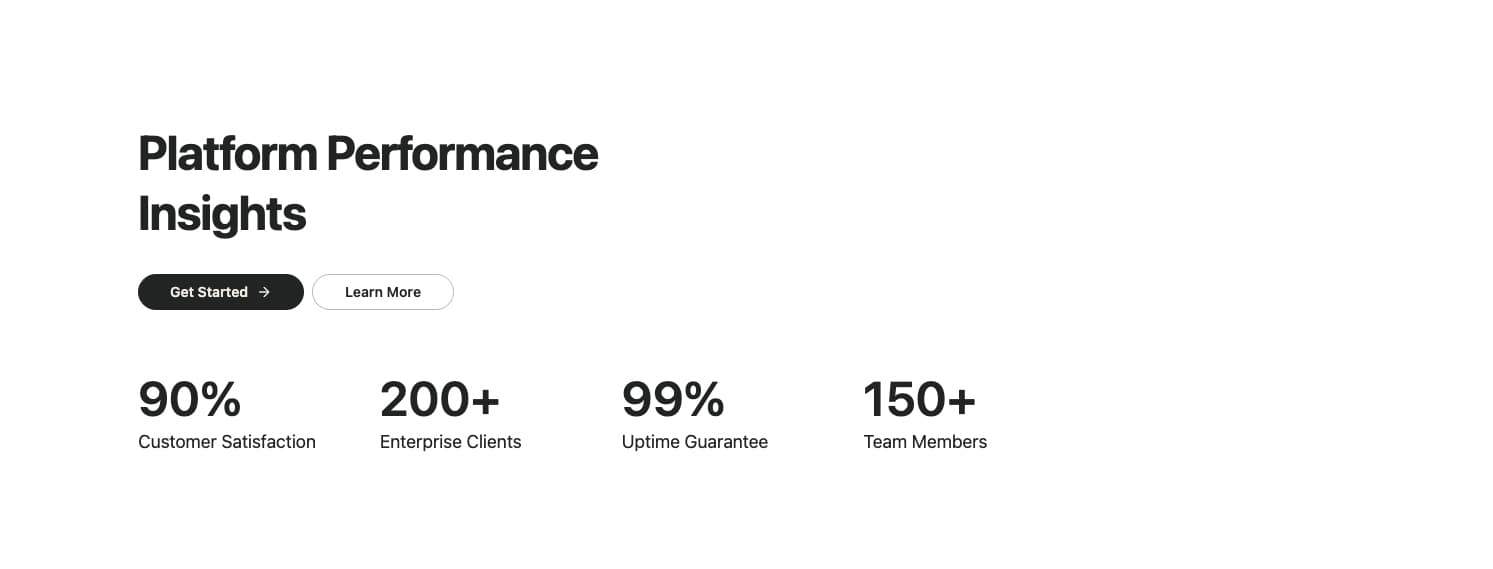
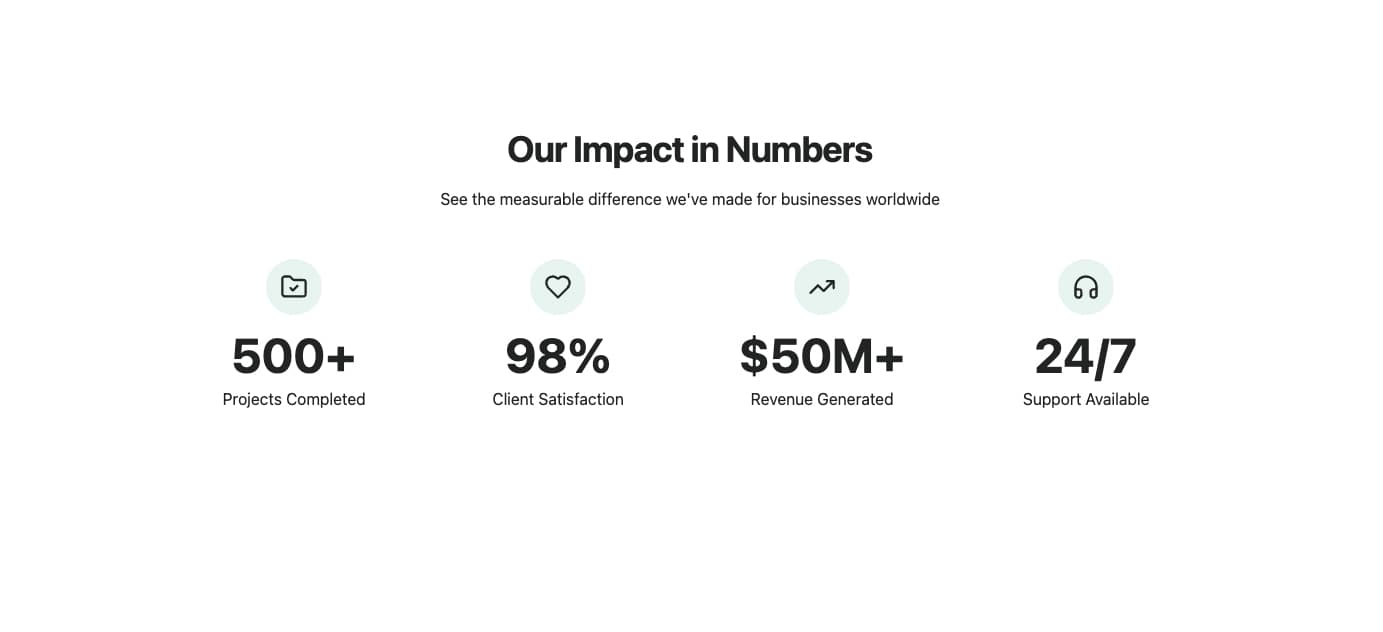
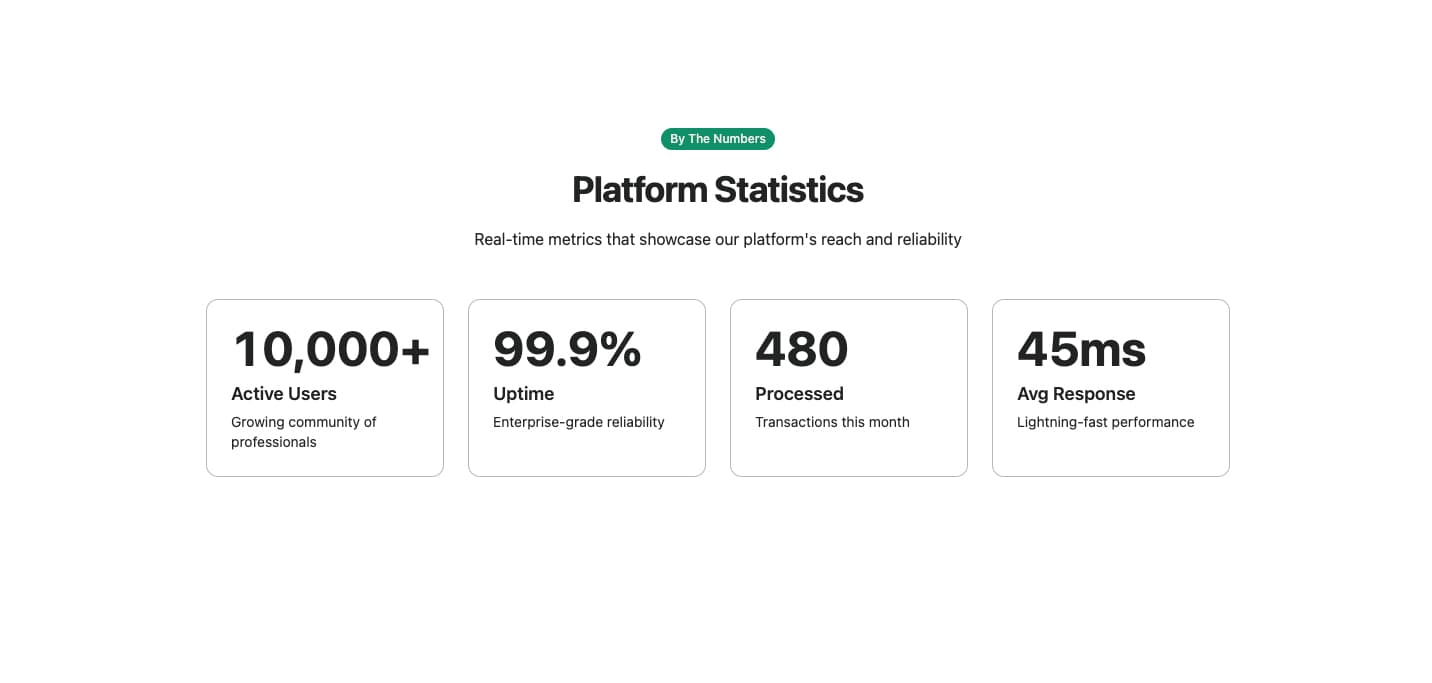
A clean, minimal stats section with a heading, action buttons, and a responsive grid of key metrics. Features a 2x2 grid on mobile that expands to 4 columns on larger screens. Ideal for showcasing company achievements, platform performance, or key business metrics with prominent numerical values.
A modern stats grid featuring bordered cards with icons, large numerical values, and growth indicators. Each card displays a metric with a circular icon badge, prominent value, and color-coded growth trend. Ideal for dashboards, analytics sections, or showcasing key performance indicators with visual hierarchy.
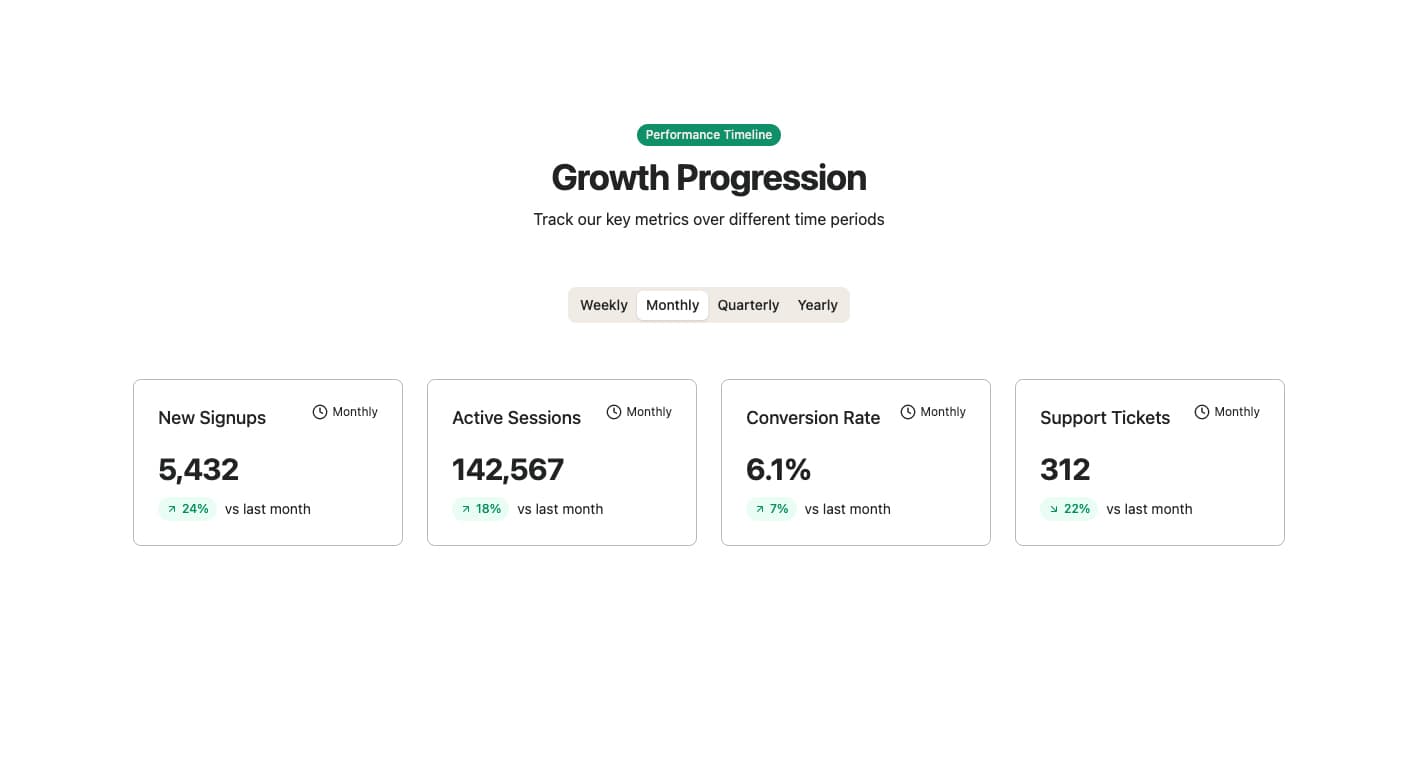
A tabbed stats display showing metrics across different time periods (weekly, monthly, quarterly, yearly). Features a badge header, centered tab navigation, and a responsive grid of stat cards with color-coded trend indicators. Each stat shows the value, percentage change, and comparison period. Ideal for analytics dashboards, performance reports, or any time-series data visualization.
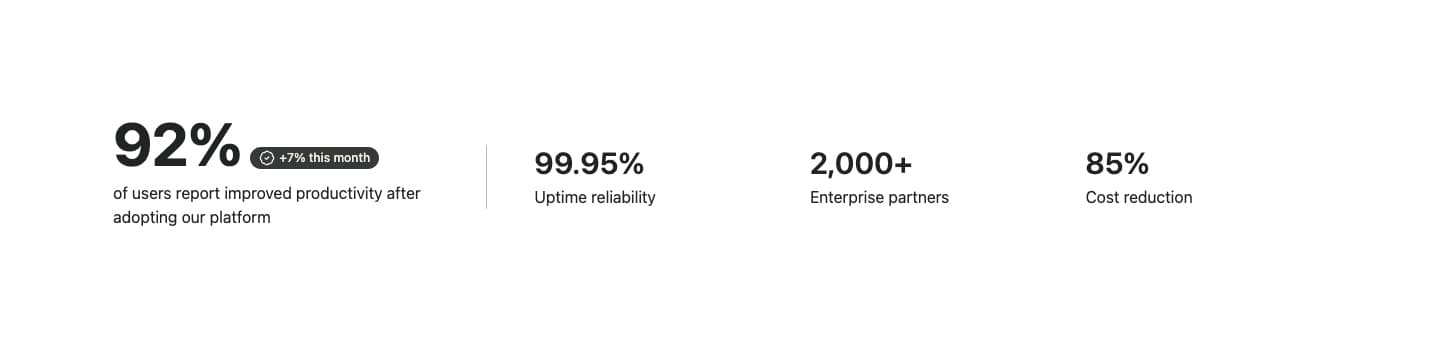
A two-column stats layout featuring one prominent primary metric with a badge indicator, alongside a row of secondary supporting stats. The primary stat is emphasized with large typography and a verification badge, while secondary stats are displayed in a clean grid with a vertical divider. Ideal for highlighting a key achievement with supporting metrics.
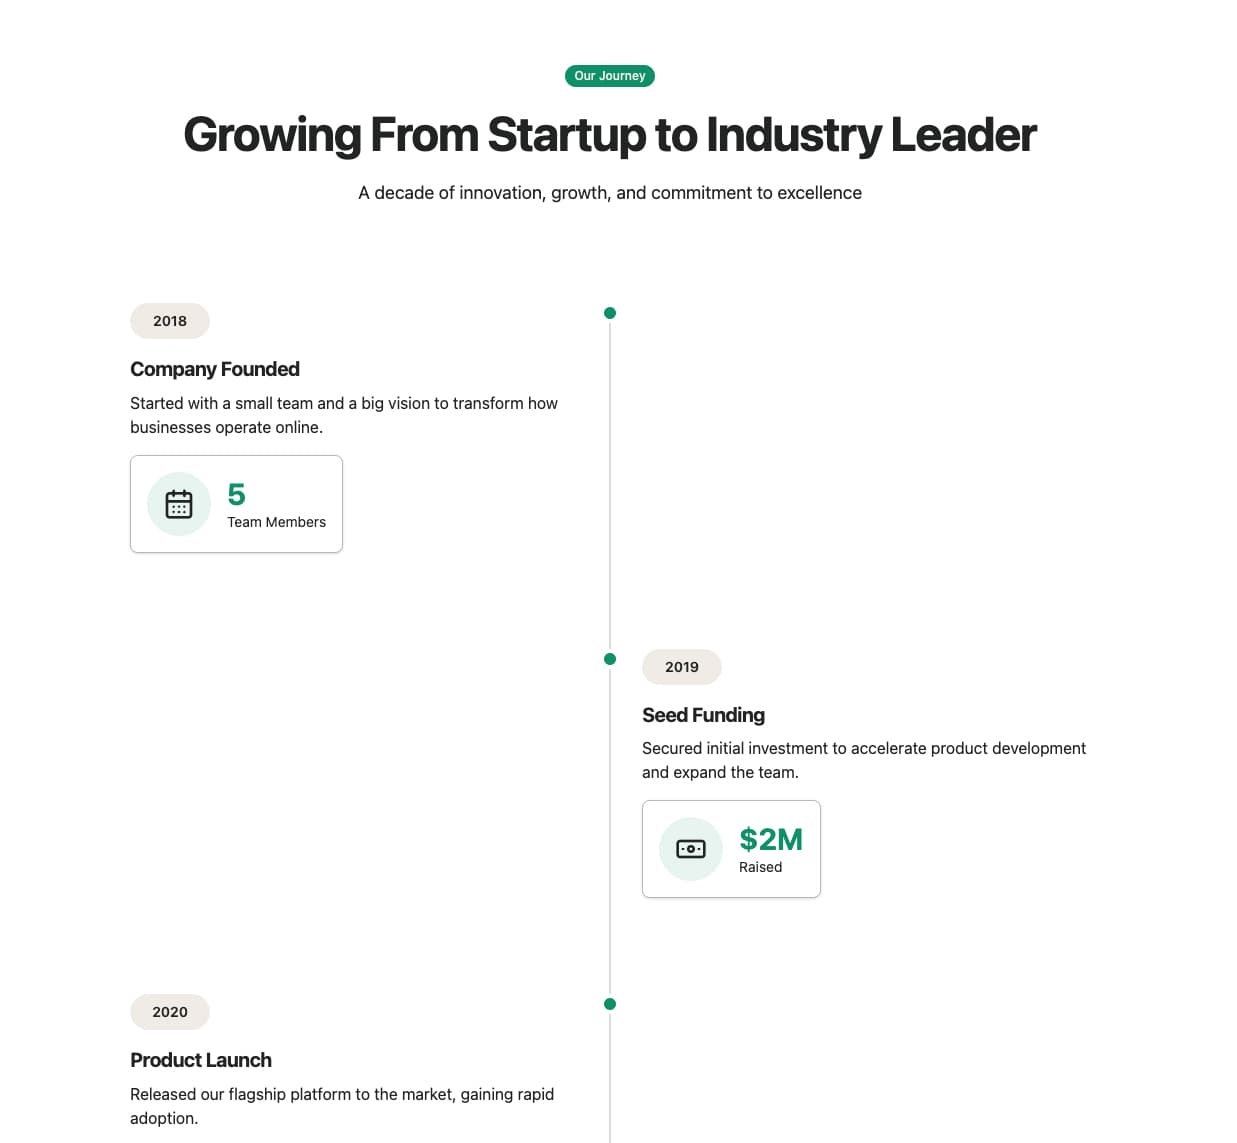
A vertical timeline showcasing company milestones and growth journey. Features alternating left/right content placement, year badges, milestone cards with icons and metrics, a 'Where We Are Today' summary section, and a future roadmap CTA. Ideal for about pages, investor presentations, or company history sections.
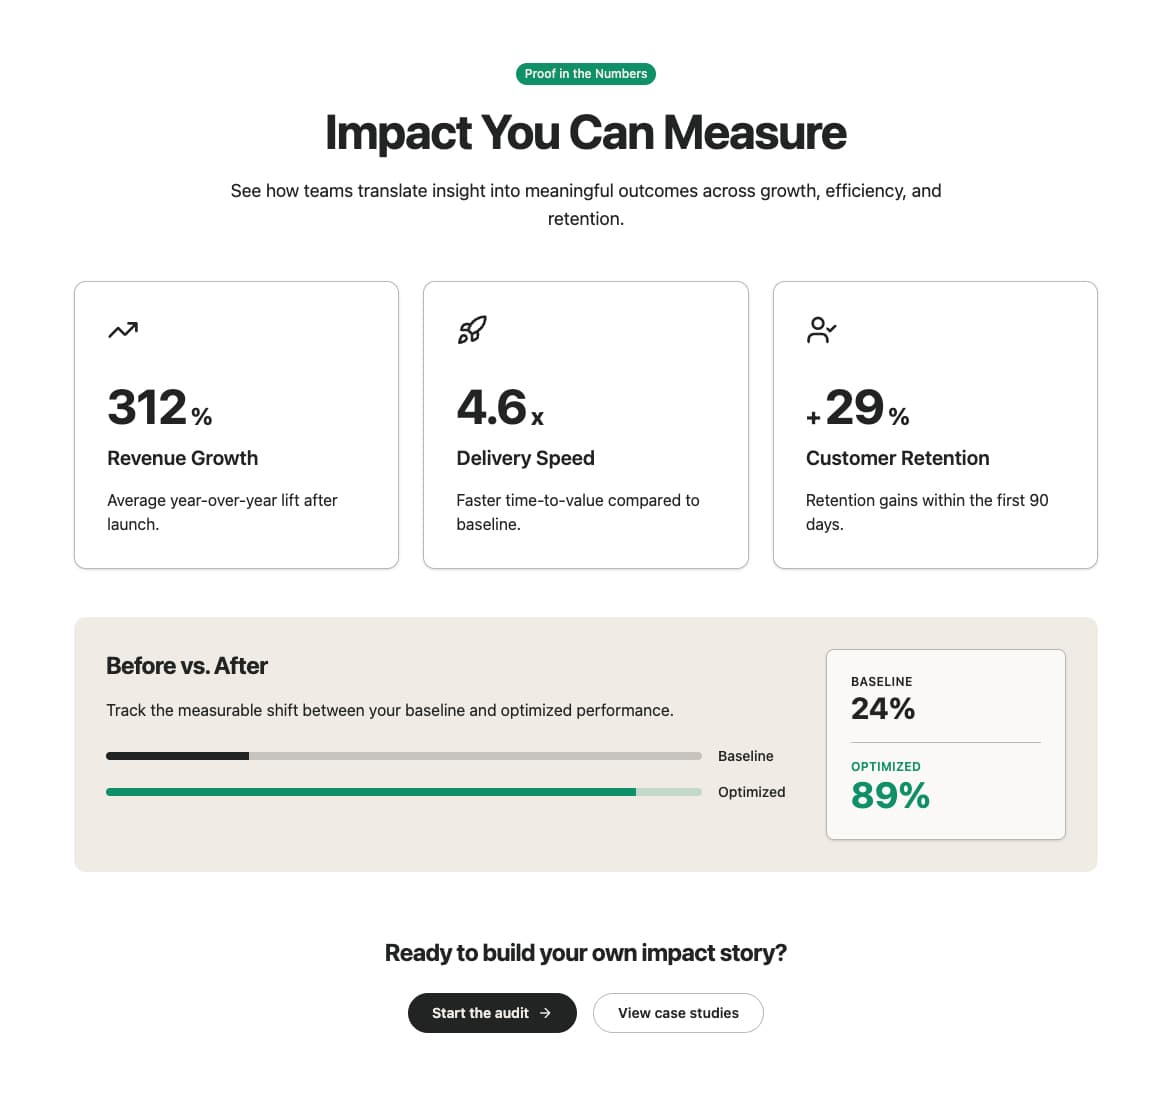
A comprehensive stats section featuring a grid of impact metrics with icons, an industry comparison bar chart, and a call-to-action. Each stat card displays an icon, large value with prefix/suffix, label, and description. Includes a visual comparison between industry average and platform performance. Ideal for showcasing ROI, business impact, or platform benefits with social proof.
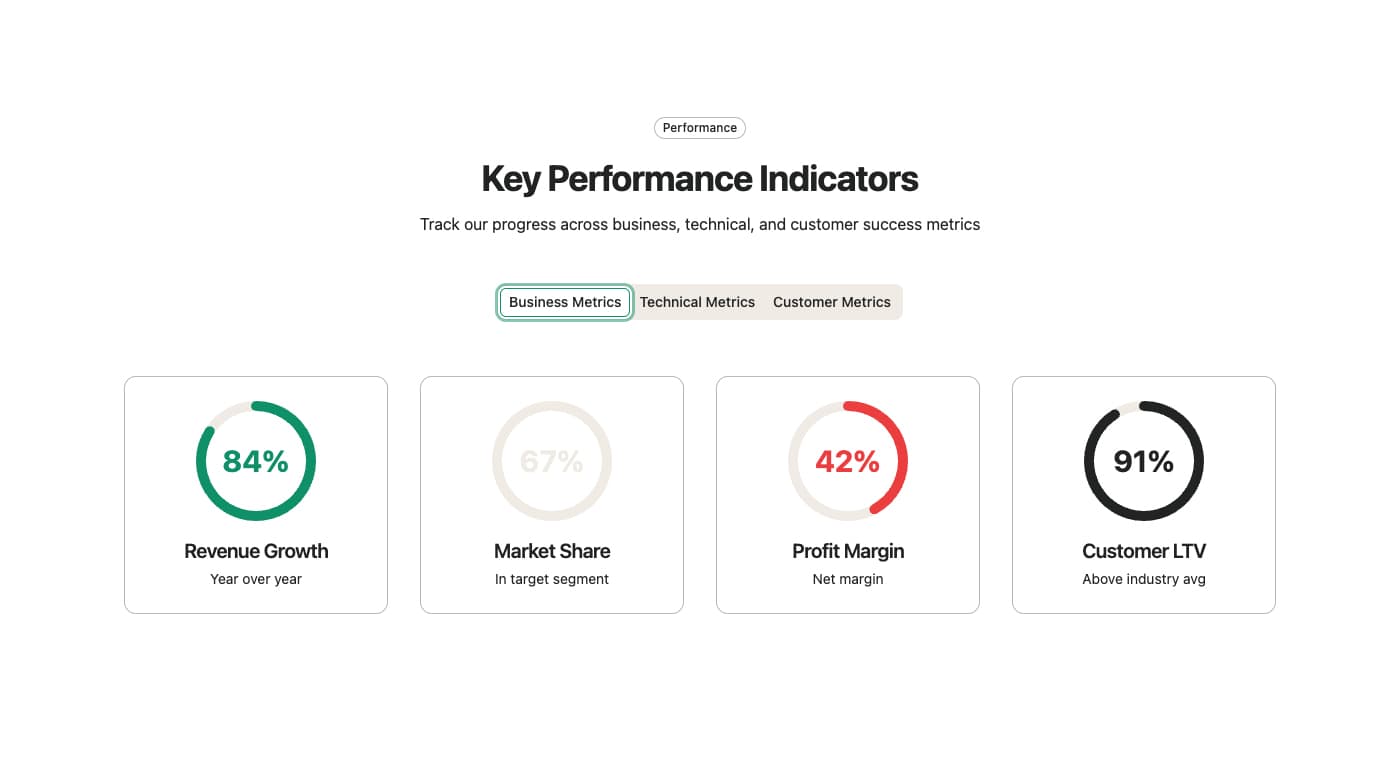
A tabbed stats display featuring circular progress indicators organized by category (Business, Technical, Customer). Each stat shows a visual circular progress ring with the value centered inside, along with a label and additional info. Includes both desktop tabs and mobile dropdown for category selection. Ideal for KPI dashboards, performance reports, or multi-dimensional metrics visualization.
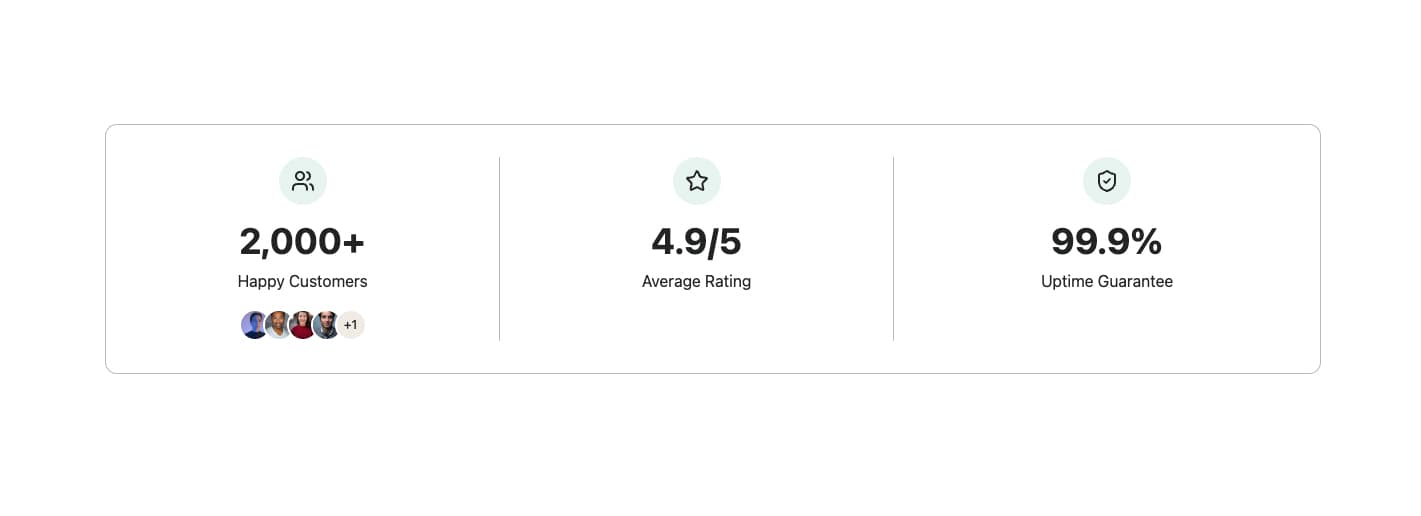
A compact stats display featuring three metrics in a bordered card with icons and optional avatar stacks. Each stat shows an icon, large value, and label. The first stat can include a stacked avatar group to represent users or customers. Ideal for social proof sections, trust indicators, or compact dashboard summaries.
A stats section featuring animated number counters that trigger when scrolled into view. Each stat displays an optional icon, animated value with prefix/suffix, and label. Uses intersection observer to start the animation only when visible. Ideal for impact sections, achievements, or any metrics that benefit from engaging number animations.
A stats section featuring smooth number ticker animations that count up when scrolled into view. Each stat card displays an animated value with optional prefix/suffix, label, and description. Uses exponential easing for a polished counting effect. Supports both integer and decimal values. Ideal for landing pages, dashboards, or any section showcasing impressive metrics.
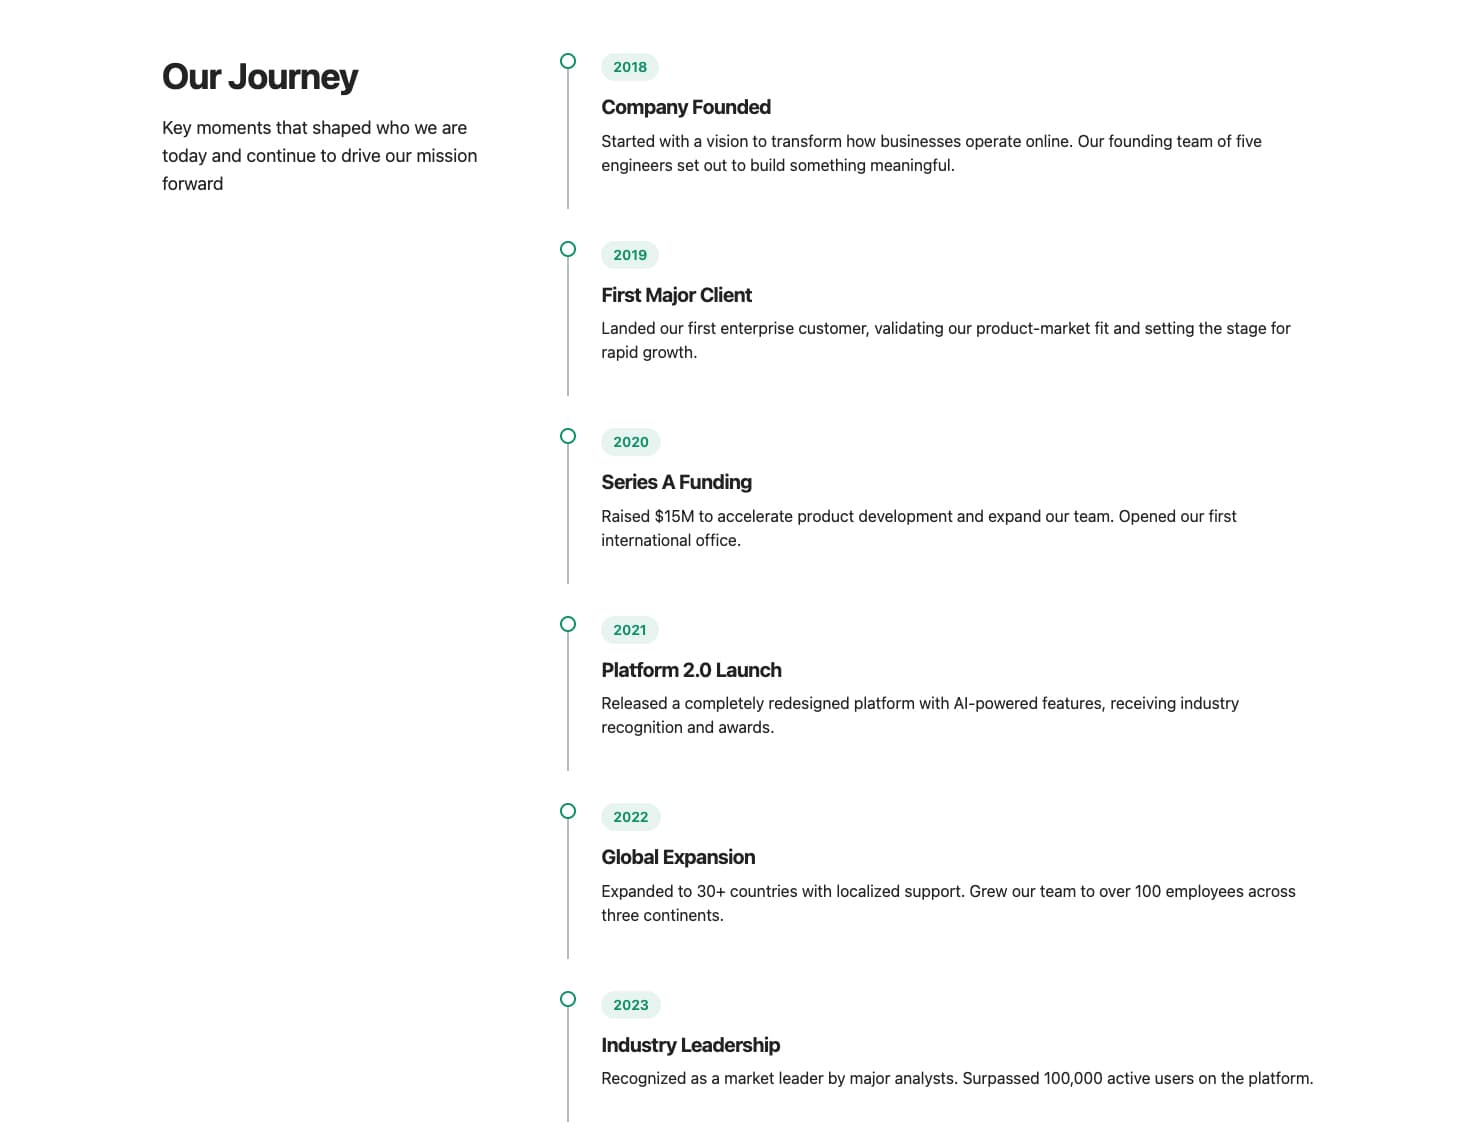
A two-column layout featuring a sticky sidebar with heading and description, alongside a scrollable list of company milestones. Each milestone displays a year badge, title, and description. The sidebar remains fixed while users scroll through the timeline. Ideal for company history pages, about sections, or investor presentations.
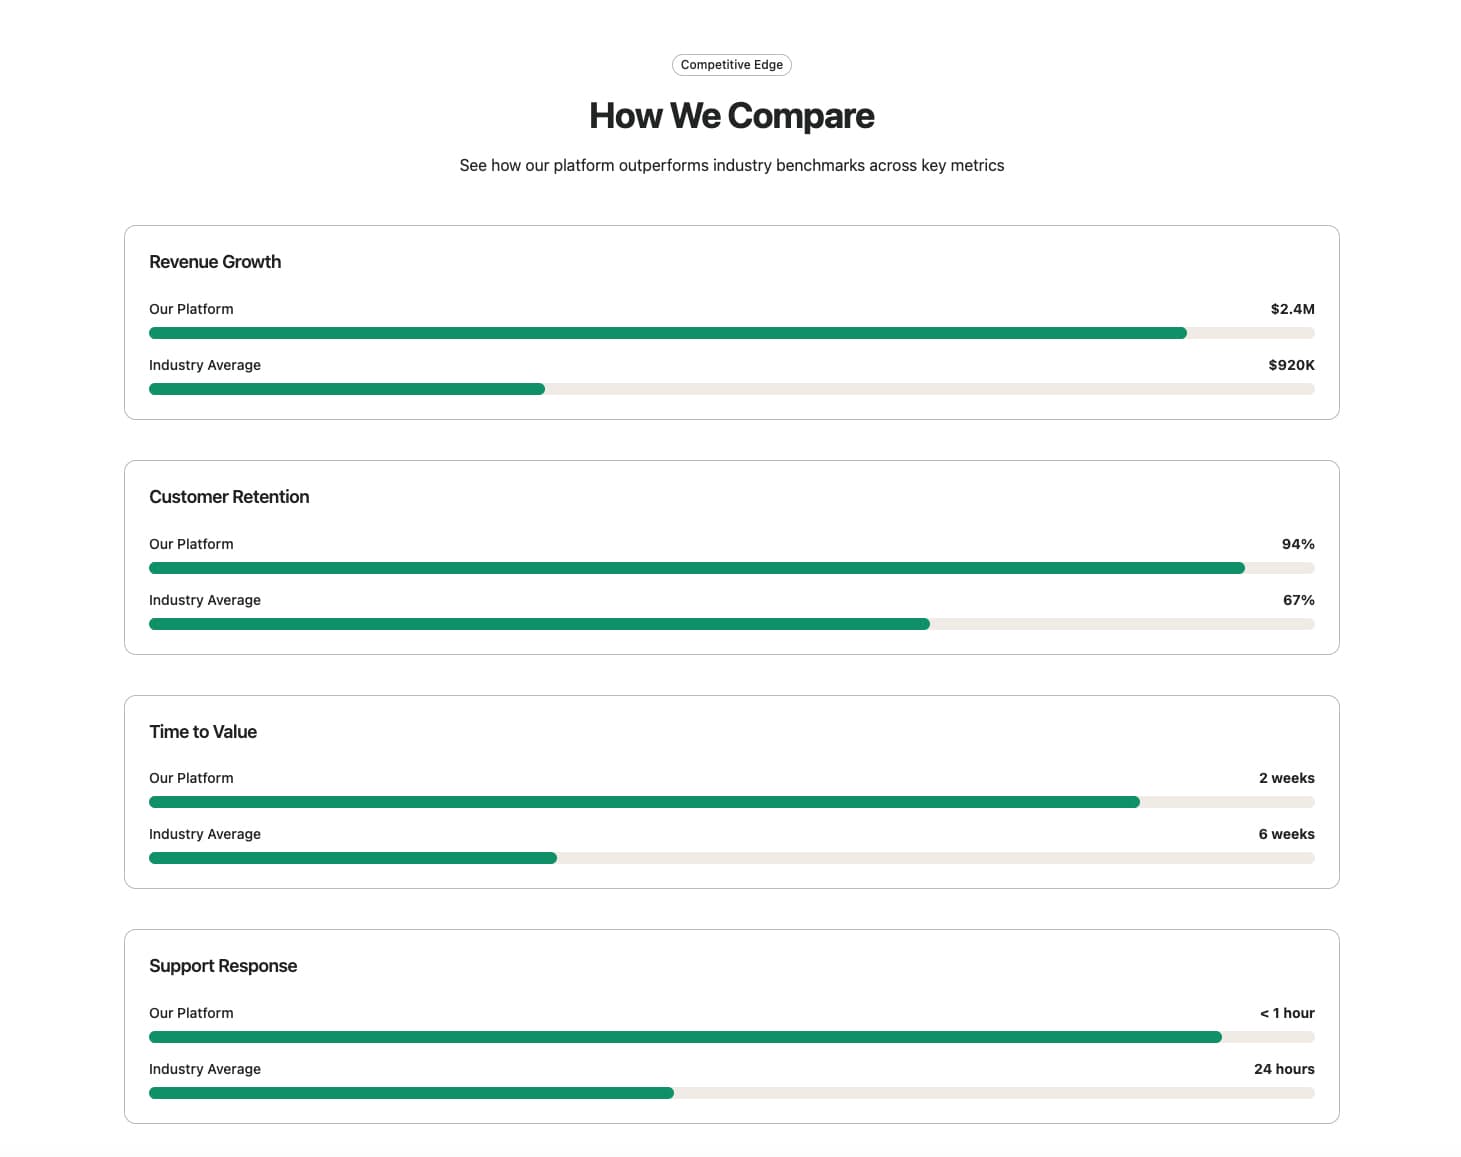
A visual comparison section featuring animated horizontal bar charts that compare platform metrics against industry averages. Each group displays a title and two bars with labels and values. Bars animate from 0 to their target width when scrolled into view. Ideal for competitive analysis, benchmark comparisons, or showcasing platform advantages.